ANOSIM Test
Purpose:
- To test if there is a statistical difference between the microbial communities of two or more groups of samples.
- Null Hypothesis: there is no difference between the microbial communities of your groups of samples.
The ANOSIM test is similar to an ANOVA hypothesis test, but it uses a dissimilarity matrix as input instead of raw data. It is also non-parametric, meaning it doesn’t assume much about your data (like normal distribution etc), so it’s a good bet for often-skewed microbial abundance data. As a non-parametric test, ANOSIM uses ranked dissimilarities instead of actual distances, and in this way it’s a very nice complement to an NMDS plot. The main point of the ANOSIM test is to determine if the differences between two or more groups are significant. In our case, it is used to test if there is a significant difference in the microbial community composition of groups of samples.
Here are some examples of sample groupings where an ANOSIM test would be appropriate:
- Healthy vs sick individuals
- Different sampling environments
- Different seasons
- Treatment vs control groups
This test is quite straightforward to do in R, and follows much of the same data manipulation as the NMDS plot. First load in your data with columns as OTUs and rows as samples, and install/load the package vegan
install.packages("vegan")
library(vegan)
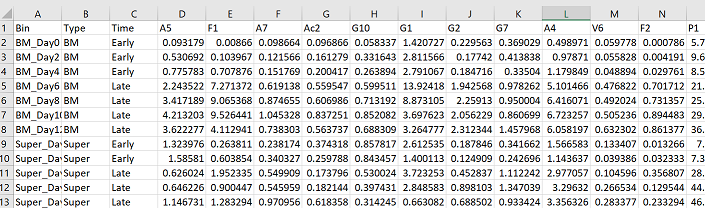
pc = read.csv("Your_OTU_table.csv", header= TRUE)
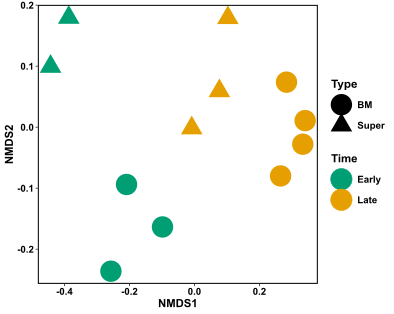
As a reminder, this is the NMDS figure we made in this tutorial. I will be checking the statistical significance of the groupings of “Time” and “Type” below.
Just like in the NMDS code, we need to make a data frame with only our abundance information. The first three columns of my data have information about my samples, so my abundance data goes from column 4 until the end. I then need to turn my data frame into a matrix.
#make community matrix - extract columns with abundance information, turn data frame into matrix
com = pc[,4:ncol(pc)]
m_com = as.matrix(com)
Now use the function “anosim” from the package vegan to test whether there is a statistical difference between your groups. In the following code, ‘m_com’ is the community abundance matrix I am testing; ‘pc$Type’ is the column (“Type”) in my data frame (“pc”) that contains the grouping information for my samples; ‘distance = “bray”’ is the dissimilarity measure (Bray-Curtis) that I would like to use in the analysis; and ‘permutations = 9999’ is the number of permutations done with the data to determine significance.
ano = anosim(m_com, pc$Type, distance = "bray", permutations = 9999)
ano
The output of the anosim test is:
Call:
anosim(x = m_com, grouping = pc$Type, permutations = 9999, distance = "bray")
Dissimilarity: bray

ANOSIM statistic R: 0.1152
      Significance: 0.1406

Permutation: free
Number of permutations: 9999
When interpreting these results you want to look at the ANOSIM statistic R and the Significance values. A Significance value less than 0.05 is generally considered to be statistically significant, and means the null hypothesis can be rejected. Therefore, there is a statistically significant difference in the microbial communities between your groups. Greater than 0.05, means that there is no statistical difference between the microbial communities in your groups.
“The ANOSIM statistic “R” compares the mean of ranked dissimilarities between groups to the mean of ranked dissimilarities within groups. An R value close to “1.0” suggests dissimilarity between groups while an R value close to “0” suggests an even distribution of high and low ranks within and between groups” (GUSTAME). In other words, the higher the R value, the more dissimilar your groups are in terms of microbial community composition.
In the example above, my significance value is 0.14, and my R value is only 0.12. Because my significance value is greater than 0.05, I would not be able to reject the null hypothesis in this case. Therefore, there is no statistical difference between the microbial communities based on Type of sample.
Now I will run ANOSIM with the “Time” grouping:
ano = anosim(m_com, pc$Time, distance = "bray", permutations = 9999)
ano
The results are:
Call:
anosim(x = m_com, grouping = pc$Time, permutations = 9999, distance = "bray")
Dissimilarity: bray

ANOSIM statistic R: 0.941
      Significance: 0.0012

Permutation: free
Number of permutations: 9999
This time, my Significance value is 0.001, and my R value is 0.941. My significance value is much lower than 0.05, and my R value is close to 1. Therefore, there is a strong, statistically significant difference in my microbial communities based on the grouping “Time”.
Reporting these statistics is sufficient for an ANOSIM test. If you want to dig deeper however, and find out which species are found statistically more abundantly in one group versus another, try Indicator species analysis Also if you have a continuous variable, rather than a categorical grouping variable, and you want to see how your microbial community covaries with the continuous variable, try a Mantel Test