MetaAmp is an easy on-line pipeline used to analyze phylogenetic marker gene datasets (i.e. 16S/18S rRNA). Below are three R functions that allow the user to perform basic data manipulation using the OTU table output from MetaAmp.
Briefly, each function does the following:
- rrna_summary: Works like a pivot table in excel by summarizing OTUs at the user defined taxonomic level
- rrna_pc: Prepares data for further analysis in R:
- Renames OTUs with the OTUID and the highest taxonomic level that could be assigned to the OTU
- Orders OTUs based on maximum abundance
- Only keeps OTUs that reach a certain user-defined abundance in at least one sample (optional)
- Transposes data so that columns are OTUs and rows are samples
- rrna_taxa: Filters OTU table for a certain taxa, given a taxonomic level (i.e. Phylum) and corresponding taxa name (i.e. Cyanobacteria)
To use these functions you first need to make sure that the R packages dplyr and stringr are installed and loaded:
install.packages("dplyr")
install.packages("stringr")
library(dplyr)
library(stringr)
Next, upload your OTU table from the MetaAmp output results folder. This file should be located within the “OTU_and_taxonomy” folder in your MetaAmp results file. The OTU table will be called the name of your MetaAmp run followed by the suffix “.OTU-table.taxonomy”
df = read.table("METAMP_RUN.OTU-table.taxonomy", header = TRUE)
The OTU table file looks like this when opened in excel:
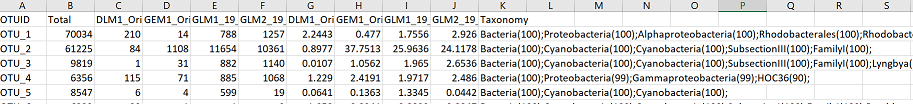
In this file, rows are OTUs. The first column is the OTUID number, unique for each OTU. The second column “Total” is the total number of sequences across all samples for that OTU. The next columns are the number of reads for each OTU in each sample (you should have a column here for each sample - in this case there are 4 samples). After these columns, the following columns contain the relative abundance of that OTU for each sample (number of OTU sequences/total sequences for that sample). And finally, the last column contains the taxonomic information for that OTU.
The code:
rrna_summary
Works like a pivot table in excel by summarizing OTUs at the user defined taxonomic level. Outputs this summary as a csv file in your working directory. The csv file will be named based on the taxonomic level you pick (i.e. “Phylum_summary.csv”)
To use the function, first copy and paste the following code into R (ending at last curly bracket)
rrna_summary = function(df, level){
  samples <- select(df, contains("..."))
  tax_df <- data.frame(OTUID = df$OTUID, samples, Taxonomy = df$Taxonomy)
  tax_df$New_tax <- tax_df$Taxonomy
  tax_levels <- str_split_fixed(tax_df$New_tax, ";",6)
  tax_names <- c("Domain", "Phylum", "Class", "Order", "Family", "Genus")
  colnames(tax_levels) <- tax_names
  tax_levels2 <- apply(tax_levels, 2, function(y) (gsub( "\\([0-9]*\\)","", y)))
  tax_levels22 <- apply(tax_levels2, 2, function(y) (gsub( ";","", y)))
  tax_levels3 <- data.frame(tax_df, tax_levels22)
  quo_level <- enquo(level)
  quo_name <- as.character(enquo(level))
  quo_name2<- quo_name[2]
  level_sum <- select(tax_levels3, !!quo_level)
  tax_level4 <- data.frame(level_sum, samples)
  tax_level4$Taxa <- tax_level4[,1]
  sum_levels <- aggregate(samples, by=list(tax_level4$Taxa), FUN = sum)
  colnames(sum_levels)[1] <- "Taxa"
  write.csv(sum_levels, file = paste(quo_name2,"_summary.csv"))
  return(head(sum_levels))
}
You have now loaded the function called rrna_summary into R.
Next, supply the parameters needed for the rrna_summary function to run: rrna_summary(df, level)
- df is the name of your data frame object that contains the MetaAmp OTU table you loaded in previously
- level is the taxonomic level that you want to summarize. Options are: Phylum, Class, Order, Family, Genus (case sensitive)
Here is an example:
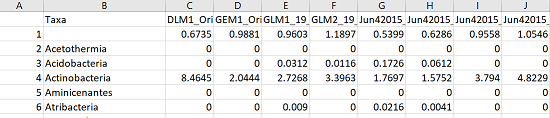
rrna_summary(df, Phylum)
This outputs a csv table called “Phylum_summary.csv” which has all OTU abundances summed into their respective phyla. The first row contains the OTUs that couldn’t be classified at the Phylum level. Here is what it looks like in excel:
rrna_pc
This function is particularly helpful for formatting OTUs for other analyses. It will put your data in the format that is used as an input for all other tutorials on these pages. It renames your OTUs to include their OTUID number and the highest level of taxonomy that could be assigned. There is also the option of including a cutoff value that will get rid of OTUs that don’t reach a certain percent of relative abundance in at least one sample. The function outputs a csv file that is named based on the percent value you pick (i.e. 1 pc_otu_subset.csv)
To use the function, first copy and paste the following code into R (ending at last curly bracket)
rrna_pc = function(df, percent){
  tax_df2 <- df[,-2]
  samples <- select(tax_df2, contains("..."))
  tax_df <- data.frame(OTUID = df$OTUID, samples, Taxonomy = df$Taxonomy)
  tax_df$New_tax <- tax_df$Taxonomy
  tax_df$short_tax<- gsub("(.*)\\(.*","\\1",tax_df$New_tax)
  tax_df$short_tax <- gsub(".*;", "", tax_df$short_tax)
  tax_df$otu_tax <- paste(tax_df$short_tax, tax_df$OTUID, sep = ":")
  columns <- ncol(tax_df)
  top_df <- tax_df[,-c(1,(columns-3):(columns-1))]
  columns2 <- ncol(top_df)
  otus <- top_df[,ncol(top_df)]
  top_dft <- as.data.frame(t(top_df[,-ncol(top_df)]))
  colnames(top_dft) <- otus
  if(missing(percent)) {
    write.csv(top_dft,  file = "otus.csv")
    return(head(top_df))
  } else {
    top_df$max <- apply(top_df[,1:(columns2-1)], 1, max)
    top_df2 <- top_df[order(-top_df$max),]
    top_df3 <- subset(top_df2, max >= percent)
    top_df4 <- top_df3[,-ncol(top_df3)]
    otus2 <- top_df4[,ncol(top_df4)]
    top_dft2 <- as.data.frame(t(top_df4[,-ncol(top_df4)]))
    colnames(top_dft2) <- otus2
    quo_perc <- as.character(enquo(percent))
    quo_perc2 <- quo_perc[2]
    write.csv(top_dft2,  file = paste(quo_perc2,"pc_otu_subset.csv"))
    return(head(top_df3))
  }
}
You have now loaded the function called rrna_pc into R.
Next, supply the parameters needed for the rrna_pc function to run: rrna_pc(df, percent)
- df is the name of your data frame object that contains the MetaAmp OTU table you loaded in previously
- percent is the minimum relative abundance an OTU must reach in at least one sample to be kept. This parameter is optional and can be left blank to retain all OTUs
Here is an example:
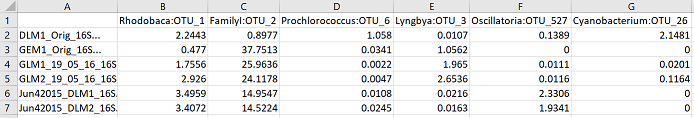
rrna_pc(df, 1)
This outputs a csv file called “1 pc_otu_subset.csv”. Only OTUs that reached 1% relative abundance in at least one sample were kept. The order of the OTU columns (left to right) is based on their maximum abundance across the samples. Here is what it looks like in excel:
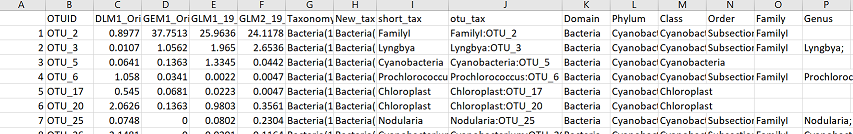
rrna_taxa
Filters OTU table for a certain taxa, given a taxonomic level (i.e. Phylum) and corresponding taxa name (i.e. Cyanobacteria). Useful if you are only interested in a particular taxonomic group. The function returns a csv file that contains all the OTUs belonging to your taxa of interest from your dataset. The end columns also contain all other taxonomic info related to that OTU, including a column called “otu_tax” which contains the OTUID along with the highest level of taxonomy that could be assigned to that OTU. Function is case sensitive.
To use the function, first copy and paste the following code into R (ending at last curly bracket)
rrna_taxa = function(df, level, taxa){
  samples <- select(df, contains("..."))
  tax_df <- data.frame(OTUID = df$OTUID, samples, Taxonomy = df$Taxonomy)
  tax_df$New_tax <- tax_df$Taxonomy
  tax_df$short_tax<- gsub("(.*)\\(.*","\\1",tax_df$New_tax)
  tax_df$short_tax <- gsub(".*;", "", tax_df$short_tax)
  tax_df$otu_tax <- paste(tax_df$short_tax, tax_df$OTUID, sep = ":")
  tax_levels <- str_split_fixed(tax_df$New_tax, ";",6)
  tax_names <- c("Domain", "Phylum", "Class", "Order", "Family", "Genus")
  colnames(tax_levels) <- tax_names
  tax_levels2 <- apply(tax_levels, 2, function(y) (gsub( "\\([0-9]*\\)","", y)))
  tax_levels3 <- data.frame(tax_df, tax_levels2)
  quo_level <- enquo(level)
  quo_taxa <- as.character(enquo(taxa))
  quo_taxa2 <- quo_taxa[2]
  subset <- filter(tax_levels3, !!quo_level == quo_taxa2)
  write.csv(subset, file = paste(quo_taxa2,"_subset.csv"))
  return(head(subset))
}
You have now loaded the function called rrna_taxa into R.
Next, supply the parameters needed for the rrna_taxa function to run: rrna_taxa(df, level, taxa)
- df is the name of your data frame object that contains the MetaAmp OTU table you loaded in previously
- level is the taxonomic level of interest. Options are: Phylum, Class, Order, Family, Genus (case sensitive)
- taxa is the taxa of interest from the taxonomic level. The taxa name must be the same as it is in the MetaAmp output.
Here is an example:
rrna_pc(df, Phylum, Cyanobacteria)
This outputs a csv file called “Cyanobacteria_subset.csv”. The csv file contains all OTUs that were assigned to the the Phylum Cyanobacteria. The last few columns contain all taxonomic information. Here is what it looks like in excel: